One-way ANOVA and Kruskal-Wallis
Emma Rand

Introduction
Aims
In this practical you will learn how to run one-way ANOVA and Kruskal-Wallis in R, interpret their output and report the results. You will also practice choosing between them.
Learning Outcomes
By actively following the lecture and practical and carrying out the independent study the successful student will be able to:
- Explain the rationale behind ANOVA and complete a partially filled ANOVA table (MLO 1 and 2)
- Apply (appropriately), interpret and evaluate the legitimacy of, one-way ANOVA and Kruskal-Wallis including post-hoc tests in R (MLO 2, 3 and 4)
- Summarise and illustrate with appropriate R figures test results scientifically (MLO 3 and 4)
Philosophy
Workshops are not a test. It is expected that you often don’t know how to start, make a lot of mistakes and need help. Do not be put off and don’t let what you can not do interfere with what you can do. You will benefit from collaborating with others and/or discussing your results.
The lectures and the workshops are closely integrated and it is expected that you are familar with the lecture content before the workshop. You need not understand every detail as the workshop should build and consolidate your understanding. You may wish to refer to the slides as you work through the workshop schedule.
Exercises
Getting started
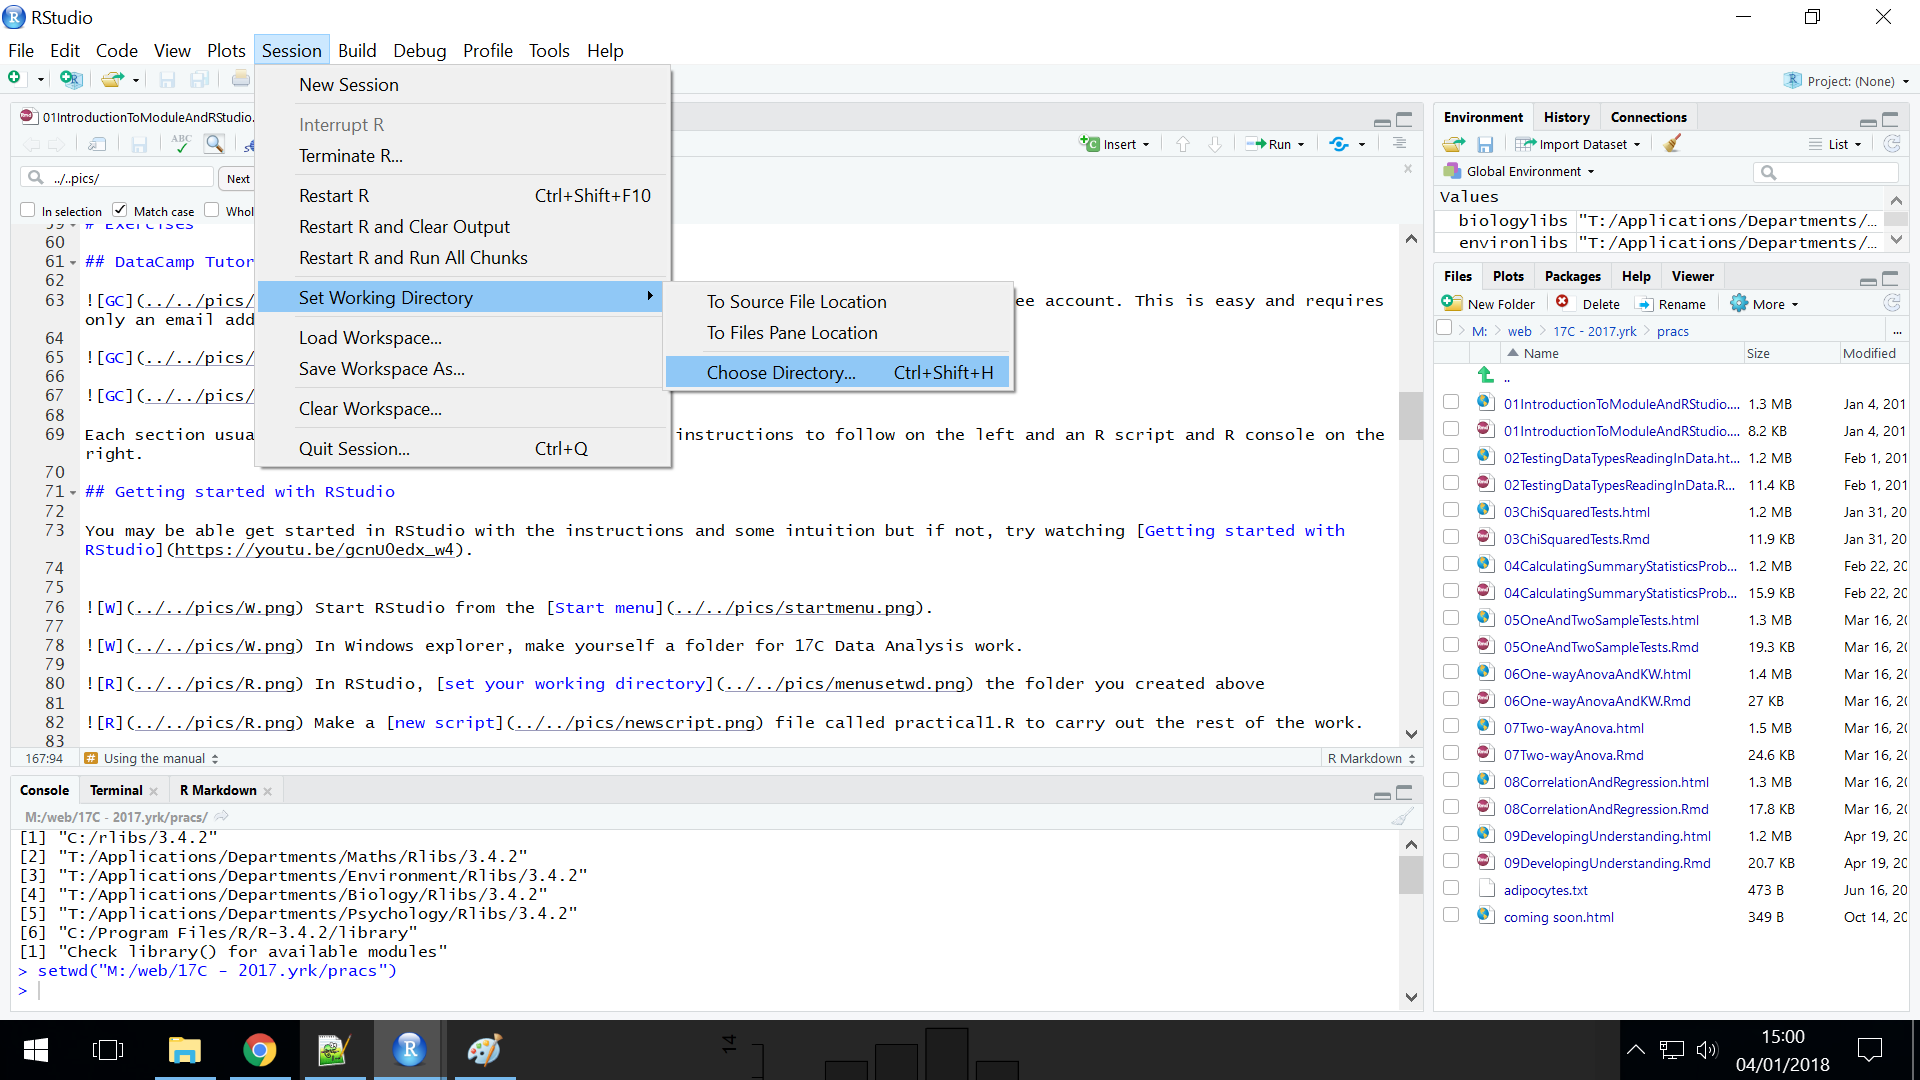
 Start RStudio from the Start menu.
 In RStudio, set your working directory to the folder you created previously for your 17C Data Analysis work.
Make a new script file called workshop6.R to carry out the rest of the work.
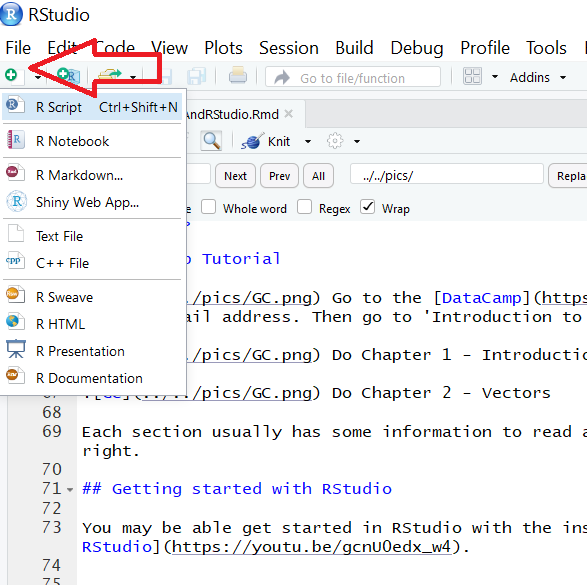
You probably want to load the tidyverse with library(tidyverse).
Myoglobin in seal muscle
The myoglobin concentration of skeletal muscle of three species of seal in grams per kilogram of muscle was determined and the data are given in seal.txt. We want to know if there is a difference between species. Each row represents an individual seal. The first column gives the myoglobin concentration and the second column indicates species.
Exploring
Save a copy to your working directory, read it in and check the structure. Do you need to check back to Week 3: Testing, Data types and Reading in data
Do a quick plot of the data. Do you need to check back to Week 7: One- and two-sample tests 
Create a data frame called sealsummary that contains the means, standard deviations, sample sizes and standard errors for each species. You may want to look this up in the lecture notes or last week’s workshop
Applying, interpreting and reporting
We can now carry out a one-way ANOVA. When doing an ANOVA it is common to assign the result of the aov() procedure to a variable, then examine it using summary()
Carry out an ANOVA and examine the results with:
##             Df Sum Sq Mean Sq F value  Pr(>F)
## species      2    692   346.2   5.352 0.00643 **
## Residuals   87   5627    64.7
## ---
## Signif. codes:  0 '***' 0.001 '**' 0.01 '*' 0.05 '.' 0.1 ' ' 1
Remember: the tilde (~) means test the values in myoglobin when grouped by the values in species. Or explain myoglobin with species.
 What do you conclude so far from the test? Write your conclusion in a form suitable for a report.
The ANOVA is significant but which means differ? We need a post-hoc test. A post-hoc (“after this”) test is done after (and only after) a significant ANOVA test. The ANOVA tells you at least two of means differ, the post-hoc test tells you where the differences are. There are several possible post-hoc tests. A popular option is the Tukey Honest Significant Difference test.
Carry out a Tukey HSD with:
##   Tukey multiple comparisons of means
##     95% family-wise confidence level
##
## Fit: aov(formula = myoglobin ~ species, data = seal)
##
## $species
##                                    diff       lwr       upr     p adj
## Harbour Seal-Bladdernose Seal  6.694333  1.742803 11.645863 0.0050207
## Weddell Seal-Bladdernose Seal  2.344333 -2.607197  7.295863 0.4989642
## Weddell Seal-Harbour Seal     -4.350000 -9.301530  0.601530 0.0968115
Each row is a comparison between means. The ‘diff’ column is the difference between the means the ‘p adj’ column indicates whether that difference is significant.
A plot can be used to visualise the result of the post hoc and make it easier to understand
Use the generic plot() function to plot the post-hoc like this:

You may want to  . This shows the confidence intervals on the differences between the means and the dashed vertical line is at zero so if the confidence interval crosses that line (i.e., the C.I. includes zero) then the means do not differ significantly.
What do you conclude from the test?
Checking selection
We need to examine the residuals. Unlike with t.test we don’t have to calculate them - the object which is created by aov() contains a variable called $residuals
Use the shapiro.test() on the model residuals
##
##  Shapiro-Wilk normality test
##
## data:  mod$residuals
## W = 0.98547, p-value = 0.4176
Plot the model residuals against the fitted values like this:
 The group means are the fitted (or predicted) values; each residual is the difference between the mean and the actual value
What to you conclude?
Illustrating
Producing a figure to go with a significant ANOVA in a report using ggplot2
Look at the we did in the last practical for egg laying behaviour of wasps - notice how the fundamental structure of the plot is the same as we require here, there is just a different number of groups. We will again use both our seal and sealsummary dataframes.
Create the plot:
ggplot() +
  geom_point(data = seal, aes(x = species, y = myoglobin),
             position = position_jitter(width = 0.1, height = 0),
             colour = "gray50") +
  geom_errorbar(data = sealsummary,
                aes(x = species, ymin = mean - se, ymax = mean + se),
                width = 0.3) +
  geom_errorbar(data = sealsummary,
                aes(x = species, ymin = mean, ymax = mean),
                width = 0.2) +
  ylab(expression("Myoglobin concentration g "*Kg^{-1})) +
  ylim(0, 80) +
  scale_x_discrete(labels = c("Bladdernose", "Harbour", "Weddell"),
                   name = "Seal Species") +
  theme_classic()
Notice the use of expression() in ylab() to allow you to specify special characters. This figure is good but it would be nice to show the result of the post-hoc host by annotating the figure. Again, ggplot makes this fairly easy.
We can add annotations to illustrate the post-hoc results:
ggplot() +
  geom_point(data = seal, aes(x = species, y = myoglobin),
             position = position_jitter(width = 0.1, height = 0),
             colour = "gray50") +
  geom_errorbar(data = sealsummary,
                aes(x = species, ymin = mean - se, ymax = mean + se),
                width = 0.3) +
  geom_errorbar(data = sealsummary,
                aes(x = species, ymin = mean, ymax = mean),
                width = 0.2) +
  ylab(expression("Myoglobin concentration g "*Kg^{-1})) +
  ylim(0, 80) +
  scale_x_discrete(labels = c("Bladdernose", "Harbour", "Weddell"),
                   name = "Seal Species") +
  annotate("segment", x = 1, xend = 2,
           y = 72, yend = 72,
           colour = "black") +
  annotate("segment", x = 2, xend = 2,
           y = 72, yend = 70,
           colour = "black") +
  annotate("segment", x = 1, xend = 1,
           y = 72, yend = 70,
           colour = "black") +
  annotate("text", x = 1.5,  y = 74,
           label = "*", size = 8) +
  theme_classic()
Figure 1. The mean myoglobin concentration of three seal species. Error bars are \(\pm\) 1 S.E.
Write up the result is a form suitable for a report.
Leafminers on Birch
Larvae of the Ambermarked birch leafminer, Profenusa thomsoni, feed on the interior leaf tissues of Birch (Betula) species. They do not normally kill the tree but can weaken it making it susceptible to attack from other species. Researchers are interested in whether there is a difference in the rates at which white, grey and yellow birch are attacked. They introduce adult female P.thomsoni to a green house containing 30 young trees (ten of each type) and later count the egg laying events on each tree. The data are in leaf.txt.
Exploring
Save a copy to your working directory, read it in and check the structure
Calculate the medians, means and sample sizes.
Why is a Kruskal-Wallis appropriate in this case?
Applying, interpreting and reporting
To carry out a Kruskal-Wallis we use:
##
##  Kruskal-Wallis rank sum test
##
## data:  eggs by birch
## Kruskal-Wallis chi-squared = 6.3393, df = 2, p-value = 0.04202
What do you conclude from the test? Write your conclusion in a form suitable for a report.
The significant Kruskal-Wallis tells us at least two of the groups differ but where do the differences lie? A post-hoc multiple comparison test for a significant Kruskal-Wallis exists in the pgirmess package.
Load the package using library()
Now run the test with:
## Multiple comparison test after Kruskal-Wallis
## p.value: 0.05
## Comparisons
##              obs.dif critical.dif difference
## Grey-White       5.1     9.425108      FALSE
## Grey-Yellow      4.8     9.425108      FALSE
## White-Yellow     9.9     9.425108       TRUE
What do you conclude from the test?
Write up the result is a form suitable for a report.
Illustrating
A box plot is an appropriate choice for illustrating a Kruskal-Wallis. Can you produce a figure like this?
Tip - Look at the grouse-nematode figure we did in the last practical for two-sample Wilcoxon.

Saving figures
A useful function for save figures is ggsave(). It has arguments for the size of the image and resolution. See the ggsave() reference page. Since I often make more than one figure, I might set these arguments first:
# figure saving settings
units = "in"
fig_w <- 3.2
fig_h <- fig_w
dpi <- 300
device <- "tiff" # this is format often required by journals; you may want png or jpg
Then I would normally assign the ggplot to a variable to pass to the ggsave() function.
fig1 <- ggplot(leaf, aes(x = birch, y = eggs) ) +
  geom_boxplot() +
  xlab("Birch") +
  ylab("Number of eggs") +
  ylim(0, 105) +
  annotate("segment", x = 2, xend = 3,
           y = 100, yend = 100,
           colour = "black") +
  annotate("segment", x = 2, xend = 2,
           y = 100, yend = 97,
           colour = "black") +
  annotate("segment", x = 3, xend = 3,
           y = 100, yend = 97,
           colour = "black") +
  annotate("text", x = 2.5,  y = 102,
           label = "*", size = 8) +
  theme_classic()


ggsave("fig1-birch.tif",
       plot = fig1,
       device = device,
       width = fig_w,
       height = fig_w,
       units = units,
       dpi = dpi)
Independent study
Decide which test you should use to analyse the following data sets. In each case give the reasons for your choice of test and state the null hypothesis. Write your conclusions in a form suitable for including in a report. Can you make figures?
Effects of fitness and heat acclimatisation
Sports scientists were investigating the effects of fitness and heat acclimatisation on the sodium content of sweat. They measured the sodium content of the sweat (\(\mu mol\mspace{3mu}l^{-1}\)) of three groups of individuals: unfit and unacclimatised (UU); fit and unacclimatised(FU); and fit and acclimatised (FA). The are in sweat.txt. Is there a difference between the groups in the sodium content of their sweat?
Insecticide effectiveness
The data are given in biomass.txt are taken from an experiment in which the insect pest biomass (g) was measured on plots sprayed with water (control) or one of five different insecticides. Do the insecticides vary in their effectiveness? What advice would you give to a person: - currently using insecticide E? - trying to choose between A and D? - trying to choose between C and B?
The Code files
These contain answers and code even though they do not appear on the webpage itself.
Rmd file The Rmd file is the file I use to compile the practical. Rmd stands for R markdown allow R code and ordinary text to be inter weaved to produce well-formatted reports including webpages.
Plain script file This is plain script (.R) version of the practical
Script example
This is an example of a well formatted analysis script for one of the independent study problems.
Objectives from previous sessions
Introduction to module and RStudio
- to explain why we need statistical tests and the logic of hypothesis testing (MLO 1)
- use the R command line as a calculator and to assign variables (MLO 3)
- create and use the basic data types in R (MLO 3)
- find their way around the RStudio windows (MLO 3)
- create, use and save a script file to run r commands (MLO 3)
- search and understand manual pages (MLO 3)
Testing, Data types and reading in data
- to able to explain what response and explanatory variables are, distinguish between data types and describe how these impact choice of test (MLO 1 and 2)
- demonstrate the process of hypothesis testing with an example and evaluate potential inferences (MLO 1 and 2)
- read in data in to RStudio, create simple summaries and plots using manual pages where necessary (MLO 3)
- create neat reports in Word which include text and figures (MLO 4)
Goodness of Fit and Contingency chi-squared tests
- recognise when to use chi-squared Goodness of Fit and Contingency tests (MLO 2)
- be able to carry out, interpret and report scientifically both types of test by hand and in R (MLO 3 and 4)
Calculating summary statistics, probabilities and confidence intervals
- Explain the properties of ‘normal distributions’ and their use in statistics (MLO 1 and 2)
- Define, select and calculate with R probabilities, quantiles and confidence intervals (MLO 3 and 4)
- Explain dependent and independent samples (MLO 2)
- Select, appropriately, t-tests and their non-parametric equivalents (MLO 2)
- Apply, interpret and evaluate the legitimacy of the tests in R (MLO 3 and 4)
- Summarise and illustrate with appropriate R figures test results scientifically (MLO 3 and 4)
